All three use the real Kerala Landslide Ledger data (every fatal landslide on a map of Kerala's districts) instead of a static thumbnail, and add big headline numbers. The two dashboards stay as linked cards.
The section turns dark, like "What we do", with the same paper grain. A glowing map of Kerala shows every fatal landslide as a dot sized by lives lost, next to three big numbers. The datasets sit in a row underneath.
Maps and dashboards on how Kerala lives, works and weathers its disasters, free for anyone to use on Nayaneethi Commons.
Every fatal landslide since 2016. Bigger dots, more lives lost.
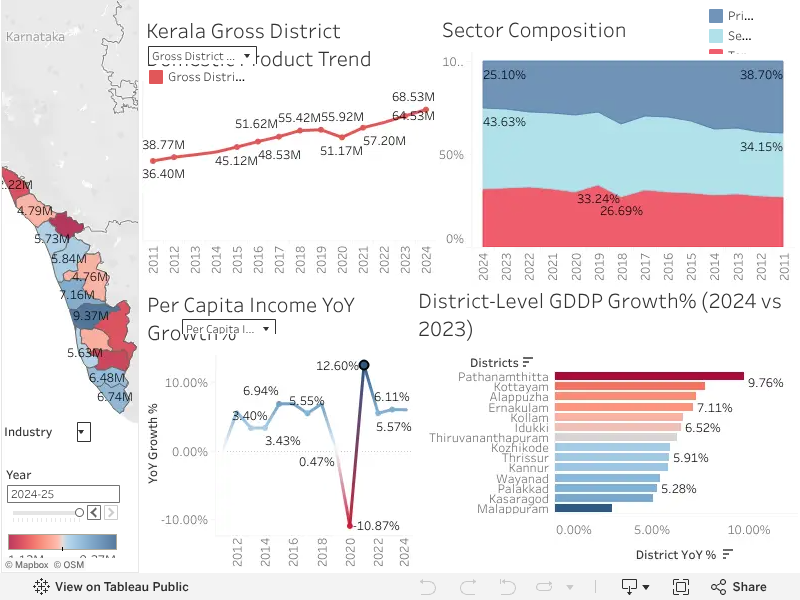
Stays light, on the graph-paper grid. Three datasets as big buttons, each with its key number; hover or click one and the large preview on the right switches to it. The Landslide Ledger shows a live map and the worst events. Interactive, but tidy.
Maps and dashboards on how Kerala lives, works and weathers its disasters, free for anyone to use on Nayaneethi Commons.
Light and editorial, like a newspaper graphic. A large map of Kerala with the three worst landslides called out by name, one huge number, and the dashboards as two small cards. Calm, but it tells a story at a glance.
542
lives lost to landslides in Kerala since 2016, tracked event by event in our Landslide Ledger.
Explore the data